おはようございます。タカハシ126(@takahashi126)です。
以前、これからの国際協力:SDGs達成には資金調達と事業効果の発言が大切か。(過去記事)という投稿でOECDのQWIDSというデータベースを引用するとともに、The Aid Transparency Indexを紹介して国際協力にかかる情報公開度合いを紹介した。
ビッグデータの時代と言われるようになってからだいぶ経った感はあるが、国際協力とか開発援助という業界でも同じことが言える。
また、最近顕著な動向としてinfographic(インフォグラフィック) というものが多用されている。
Twitterを見ているとその傾向は顕著で、文字数が限られるTwitterに印象的なインフォグラフィックが貼り付けられ、その図が含まれる報告書のリンクが貼られている。
報告書を読まなくても、ついついポンチ絵を見てわかった気になってしまう。
わかった気になっちゃうのは弊害でもあるけど、要点を一枚の図で示すインフォグラフィックはこれからますます需要が増え、今まで以上にアーティスティックだったり、斬新だったり、面白いポンチ絵が増えることは間違い無いだろう。
考えてみればプレゼンテーションで字ばっかりのパワポよりも、バーーーン!と目を引く図が出てくるとよくわからなくても「へー」とか「ほー」とかなるものだ
内容よりも見た目。要はポンチ絵。言い換えるとインフォグラフィックが大切なんだと変に納得してしまうものだ。
ここでいくつか目を引いたインフォグラフィックを紹介しよう。

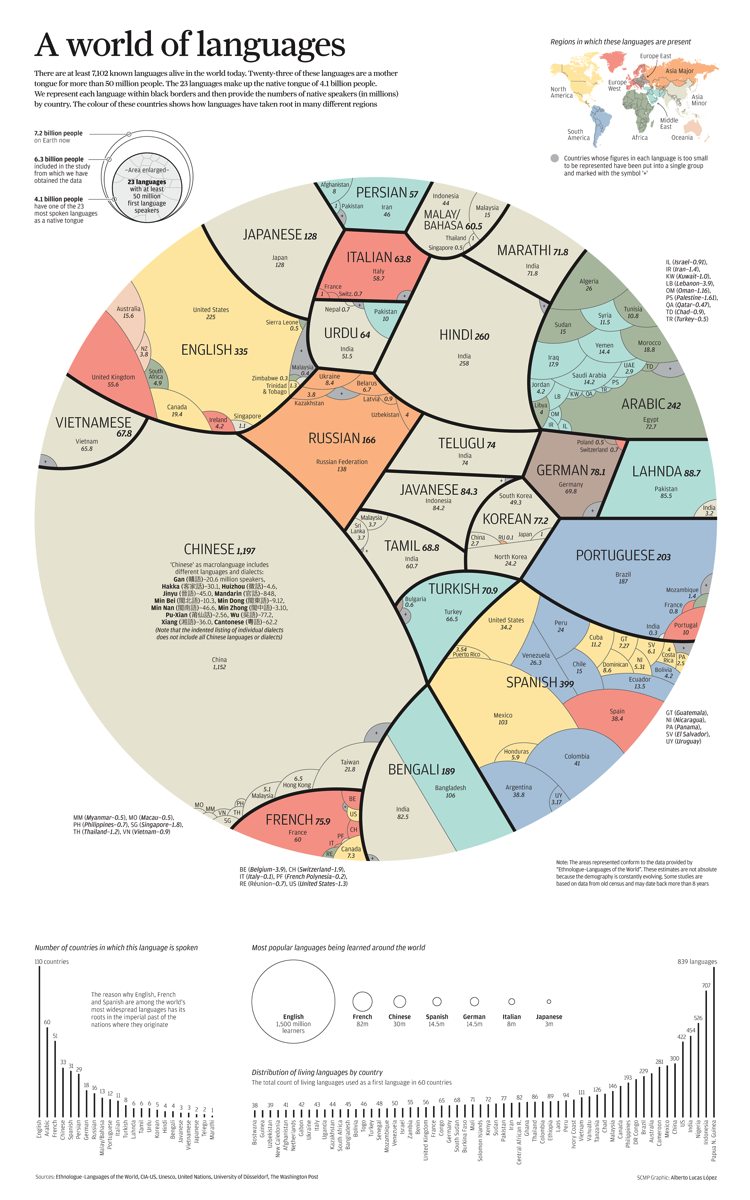
様々な言語を話す人の割合と言語同士の類似性を表したようなこの図。なんかやけに惹かれる。
こうやってみてみると1億人以上が話す言語はそれなりの存在感がある。世界は英語が中心になって回っている実感があるものの、中国語とヒンズー語の存在感はやはり圧倒的だ。
インフォグラフィックというと個人的にいつも感心するのは世界銀行の図表だ。
#SDGAtlas: Water supplies per person halved over the past 50 years and water shortages affect many countries: https://t.co/KZZ0FHGXy1 #SDG6 pic.twitter.com/CBqlr0xBuZ
— World Bank Water (@WorldBankWater)
Infographic | As fragility increases, access to #drinkingwater and #sanitation drops markedly: https://t.co/CkDplkPIJo #watersecurity #SDG6 pic.twitter.com/SE1eEKg3bn
— World Bank Water (@WorldBankWater)
#WBGEP2017: Low-income country growth will rise to 5.4% in 2017; #oil, #metals exporters to recover gradually: https://t.co/Sb4PxnAKPB pic.twitter.com/RCpKEVeQlQ
— World Bank (@WorldBank)
#SubSaharan #Africa was most affected by #malaria in 2015, with 234 per 1,000 persons at risk. https://t.co/h4yxy5ZfzD #SDGAtlas #WDI2017 pic.twitter.com/lTutwEm3a0
— World Bank (@WorldBank)
RT @FAOclimate Infographic | How can forests and wood products propel a #lowcarbonfuture? https://t.co/ywTXKe74fO #climatechange pic.twitter.com/pifYUrdojo
— World Bank (@WorldBank)
6 ways to a #GreenAfrica: building inclusive, sustainable, and resilient cities. View the facts: https://t.co/QxmIQjjC4j #AfricanCities pic.twitter.com/tIPRHbsS7c
— World Bank (@WorldBank)
RT @WHO #Climatechange threatens your health.#ClimateChange is expected to cause 250,000 additional deaths per year between 2030-2050 pic.twitter.com/3vjTFyPzbr
— World Bank (@WorldBank)
The Middle East’s start-up scene – explained in five charts https://t.co/ghgOtHeJ0T #mena17 pic.twitter.com/39ocnBAA17
— World Economic Forum (@wef)
なるほど!というものもあれば何を言いたいのかわからないけど、なんか惹かれるものまで。笑
匿名でのご質問などはこちらから http://ask.fm/takahashi126
タカハシ126とは:自己紹介


